The other day Suzie and I participated in an author talk with a special interest group for media specialists, ISTE's SIGMS. We touched on the topic of infographics and folks wanted to know what tools people use to make them.
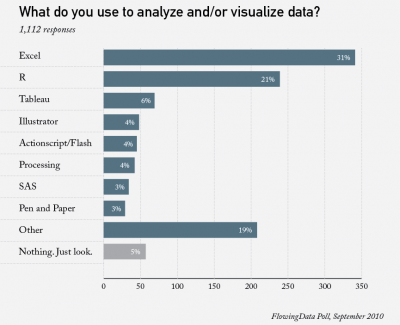
Wouldn't you know it, Flowing Data, the infographics site I recommended to the group, just polled their readers about their design tools and the results are here!

In addition to these I know student Michael Greenberg uses InDesign, and others recommend these:
Google Spreadsheets: http://www.google.com/googlespreadsheets/try_out.html
Science Pipes(for biodiversity data) http://sciencepipes.org/beta/home
Tableau Public: http://www.tableausoftware.com/public
Inkscape: http://inkscape.org
Glogster (for interactive poster-making): http://www.glogster.com


